By Unkover Editorial · Last updated: April 28, 2026
TL;DR
- What you get: a lean 8-field win/loss analysis template (XLSX + Google Sheets copy link) and a 12-question interview script (PDF) with probe prompts.
- Who it's for: CI managers, product marketers, and RevOps leads running their first structured win/loss program at a 50–500-person SaaS.
- Why it's different: it tells you what to cut, not what to add — and ships the workflow that keeps sales reps filling it in at all.
- Download: Win/Loss Analysis Template (XLSX) · Interview Script (PDF)
Most win/loss analysis templates ship with 20-plus columns, no opinion on what matters, and no plan for completion. That's why the sheet dies in a shared drive by Q2.
This one is the opposite. Eight fields, a 12-question interview script, a reporting tab that turns ten interviews into a pattern, and a workflow that ties completion to a ritual your sales team already runs. For the full program context, see our 7-step win/loss analysis guide; otherwise, keep reading.
What a win/loss analysis template needs
A win/loss analysis template needs exactly enough structure to surface why deals were won or lost — and nothing more. Eight fields is usually the ceiling: deal identifier, outcome, ARR, cycle length, primary competitor, top reason, source of that reason, and close date. Everything beyond that should earn its spot or get cut.
Win/loss programs are now table stakes at mid-market SaaS. Klue's 2025 Win-Loss Trends Report (313 leaders) found 98% of programs have executive visibility and 40% of closed deals on average are analyzed. The programs that work aren't the ones with the biggest spreadsheet — they're the ones where sales fills it in at all.
The 8 minimum viable fields
The list below is intentionally lean. Every extra field you add is a field a sales rep skips or fakes unless it's wired into a tool they already touch — CRM stage change, call recording auto-fill, the Monday deal review. The 8-field cut isn't about aesthetics; it's a workflow choice. Keep the template small enough that "fill it in" is a 90-second job, not a 15-minute one.
| # | Field | Type | What decision it powers |
|---|---|---|---|
| 1 | Deal ID | Text | De-duplicates against CRM; keeps customer names out of shared docs |
| 2 | Outcome | Win / Loss / No-decision | Splits the two most actionable failure modes (lost to competitor vs. lost to status quo) |
| 3 | ARR (or deal size) | Number | Weights patterns by revenue — not every loss costs the same |
| 4 | Sales cycle length (days) | Number | Flags friction in the buying process before it shows up in pipeline velocity |
| 5 | Primary competitor | Dropdown | Feeds battlecard updates and competitive win-rate tracking |
| 6 | Top reason (one sentence) | Freeform | One clear cause beats three ranked check-boxes — see Clozd's guidance below |
| 7 | Source of reason | Rep self-report / CRM / Buyer interview | Tags the credibility of the "why" so you know what to trust |
| 8 | Close date | Date | Enables month-over-month and quarter-over-quarter cohorts |
Field 6 is freeform on purpose. Clozd's interview framework favors open-ended, story-eliciting questions over rigid rubrics — a one-sentence top reason forces probing for the real cause instead of logging a score (Clozd, Win-Loss 101). Field 7 is the quiet hero: it separates what the rep assumed from what the buyer said. Those disagree more often than you'd expect.
📌 Make sure your template gets filled in — every deal.
A great template is necessary but not sufficient. The framework around it is what decides whether sales fills it in honestly. Three ways to wire completion into how your team already works:
- Integrate, don't isolate. Embed the template in the CRM, call-recording tool, or deal-review doc your team already opens daily — not a separate Sheet nobody bookmarks.
- Tie completion to an existing ritual. Hook win/loss capture to the weekly forecast call or pipeline review you're already running. No new meeting required.
- Align incentives. Make filling the template part of the deal-close definition — a CRM stage gate — and make reviewing the data a named KPI for someone, not "an extra job."
As Unkover's founder put it: "The template is fairly simple. The key thing is really aligning the sales team in filling it out, aligning incentives, making sure people fill in the right information."
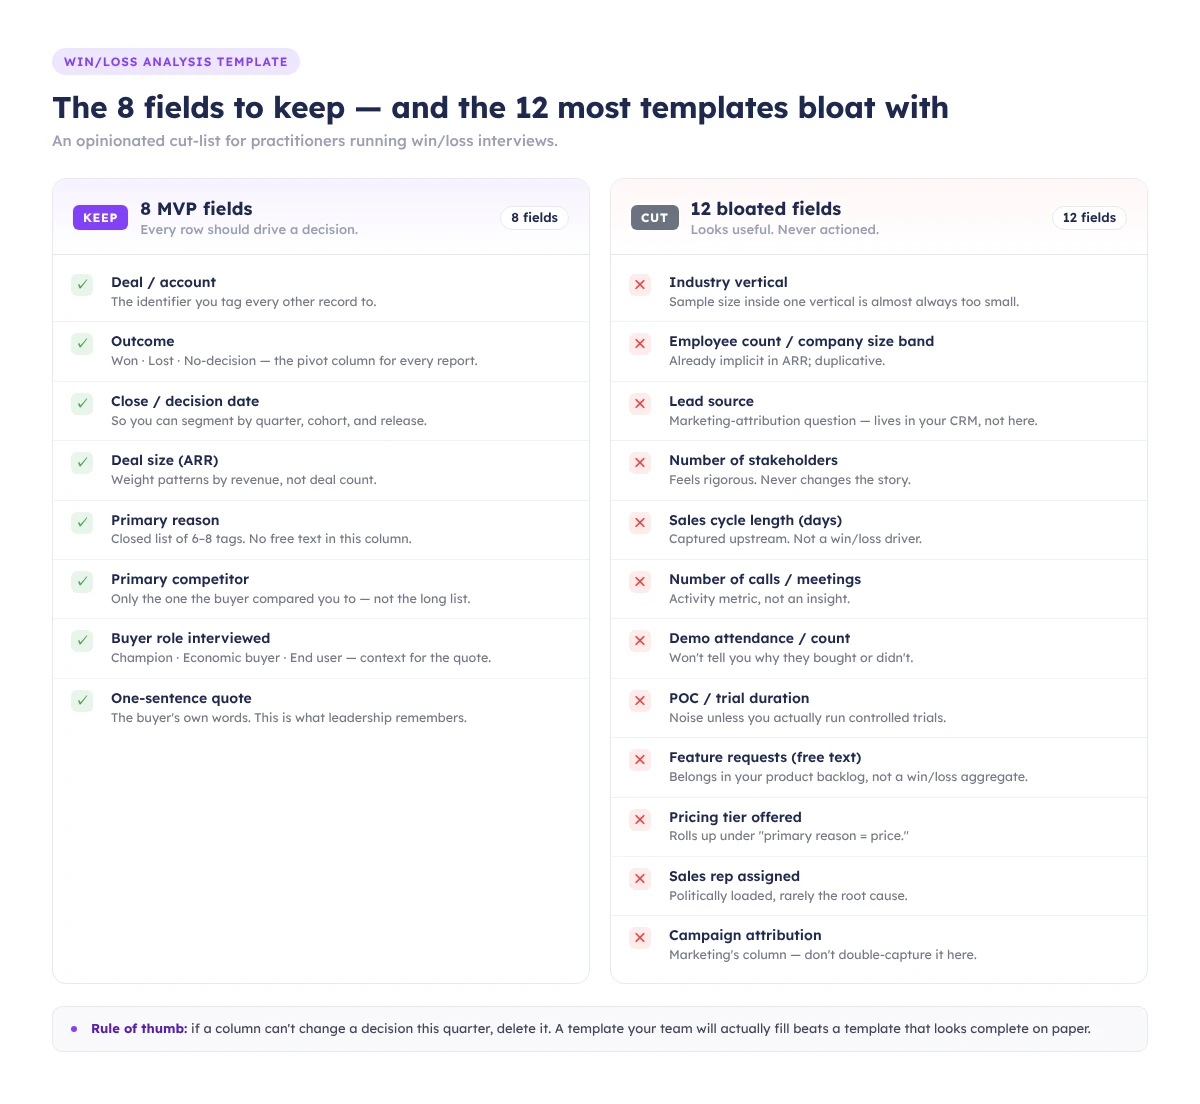
The 12 fields most templates include — and why you should cut them
The top-ranking templates on Google ship 20-plus columns. Most won't get populated; some will get fake-populated, which is worse. Below are 12 fields that look useful, attract no pushback in a planning meeting, and quietly kill your completion rate. Cut them unless a specific decision in your program needs them.
Ibby Syed, founder of Cotera, told exactly this story in February 2026: he inherited a 23-column win/loss spreadsheet, found 4 completed rows out of ~80 deals, replaced it with 7 columns, and hit 90%+ completion over a year. "Strong templates limit choices and force detail. Fewer buckets lead to better thinking."
| Tempting field | Why it looks useful | Why it's noise |
|---|---|---|
| Lead source / marketing channel | "Attribution!" | Already in your CRM and marketing attribution tool. Don't duplicate — join on Deal ID at analysis time. |
| Industry vertical | Segmentation | Same as above — pull from CRM account data. Asking the rep wastes the field. |
| Full decision-maker title list | "Who really decided?" | Reps will either leave it blank or paste titles from the CRM contact role field. No new signal. |
| Buying committee size | "Is enterprise different?" | Useful in aggregate, but inferable from contact records. Stop double-entering. |
| Evaluation start date | Cycle analysis | You already have it — it's "Close date" minus "Opportunity created date." |
| Number of demos performed | Engagement metric | Gong/Chorus/HubSpot tracks this. Don't make a human count meetings. |
| Security/compliance requirements | Product feedback | Critical in the interview as a probe. As a standalone field, it's either "none" or a wall of text. |
| Integration requirements | Product feedback | Same logic — capture in interview notes, not a dropdown. |
| Pricing tier offered | Revenue analysis | Pull from Salesforce/HubSpot. Never ask a rep to retype it. |
| Discount applied (%) | Margin analysis | Pull from CPQ or the signed order form. |
| Buyer sentiment (1–5 rating) | "Score how happy they were" | Scale ratings invite shallow answers. A one-sentence "top reason" forces the real cause out of hiding; a Likert field won't. |
| Multi-competitor tracking (ranked list) | Competitive context | Ranked lists collapse to "what the rep half-remembers." One primary competitor is enough; use the interview for shades of gray. |
The test for any field: what decision does this column power, and who will look at it? If the answer is "no one" or "I'm not sure," delete it.
The interview script template
The script covers 12 open-ended questions across five categories — buying trigger, evaluation, competitive, decision, and perception gap — with a probe prompt under each. Thirty minutes, one buyer, recorded with consent. The goal isn't a data dump; it's three usable quotes and one surprise per call.
Keep the script short for a reason. "The buyers that jump on the call with you, this is not their full-time job. They're taking time out of their day to spend 30 minutes to give you insight" — Clozd, Win-Loss 101. Respect the time, or they hang up.
The full PDF with all 12 questions and their probes is in the download bundle. A shortened version:
- What was going on at your company that made you start looking? (Probe: who first raised it?)
- What were the top 3 criteria on your shortlist? (Probe: which mattered most at the end?)
- How did you first hear about us?
- Walk me through the evaluation — who was involved, and when?
- Which alternatives did you seriously consider?
- What did [competitor] do well that we didn't?
- How did pricing enter the conversation? (Probe: was it budget, or was it value framing?)
- What did you think of our demo? (Probe: anything confusing or oversold?)
- What nearly made you pick someone else?
- What was the single biggest reason you [picked us / picked them]?
- What would have to be true for you to reconsider in 12 months?
- Anything we didn't ask that you think we should know?
Recording & consent. Ask for consent at the top of every call: "This is a 30-minute conversation to help us improve. I'd like to record for note-taking — we won't share the recording externally. Is that okay?" Log the consent in your notes. No recording without it.
The reporting template: turning 10 interviews into a pattern
The reporting tab aggregates interview notes into five tag buckets — pricing, product, people, process, positioning — then ranks them by frequency and revenue at stake. Ten interviews is usually enough to see a pattern; fewer and you're reading tea leaves. Run the aggregation quarterly at minimum.
First, tag by root cause, not symptom. "Too expensive" is a symptom; the root cause is usually value framing or the wrong ICP. Second, weight by ARR — five $10K pricing losses and one $300K security loss are different-shaped problems.
One structural reminder: your CRM is not your dataset. Clozd compared CRM closed-lost reasons against buyer interviews for 1,000 deals and found alignment only 15% of the time (Clozd, 5 Lies Your CRM Is Telling You About Your Buyers). Running win/loss off the close-reason dropdown is pivoting bad data. Use the CRM for ARR and close date; use the interview for the why.
Win/loss analysis example: a walkthrough
A win/loss analysis example makes the fields concrete. Here's a walkthrough on fictional but plausible data — a Series B B2B SaaS we'll call "Proxima." Same 24 closed-lost deals, two different templates, two different root-cause reads, two different weekly actions. The point: the template you choose shapes the decision as much as the data does.
Q1 2026, 24 closed-lost deals. CRM close-reasons: Pricing (11), Product gap (7), Timing (4), No decision (2). Pricing looks like the story. Proxima's CI manager runs 8 stratified interviews: 4 pricing losses, 2 product losses, 2 no-decisions.
What surfaced in interviews versus the CRM:
- 4 "pricing" losses → only 1 was truly about list price. The other 3 were value-framing problems: the buyer couldn't articulate ROI to their CFO. Root cause: positioning.
- 2 "product gap" losses → both flagged the same missing feature (SSO on the starter tier). Root cause: product. Clean signal.
- 2 "no-decision" losses → both buyers said the internal champion left mid-evaluation. Root cause: people, not timing.
ARR-weighted, the top pattern became value framing on mid-market deals (~$420K ARR at stake). Proxima's action the following week: a 2-slide ROI calculator for the sales team plus a battlecard update around the SSO gap — not the price cut the CRM dashboard was suggesting.
Same data, different template, different decision.
How to act on the output within a week
Findings expire fast. The week after you close your interview batch, turn the top two or three patterns into one concrete change each: a battlecard update, a product feedback ticket, a pricing experiment, or a messaging tweak. If nothing ships in seven days, the cadence is broken and the rest of the program will rot.
Three practical handoffs by Friday:
- Battlecard update. Your #1 competitor pattern feeds a battlecard refresh: strongest objection, best counter, the one line the rep should say out loud on the call.
- Product feedback ticket. File repeat product gaps with revenue at stake. "SSO on starter — $420K ARR exposed in Q1" lands harder than "customers want SSO."
- Messaging or pricing test. Framing gaps become a landing page hero; pricing-perception gaps become a pricing page A/B test.
The analysis loop only works if the input loop works. Without the integration and incentive alignment from the call-out above, reps will fake it or skip it — and you'll spend Friday acting on patterns you imagined rather than patterns you found. Fix the input loop first; the output loop needs real data to act on.
Clozd's 2025 State of Win-Loss Analysis Report found 63% of organizations saw win rates increase after running a program — rising to 84% past the two-year mark — and their ROI analysis pegs disciplined programs at 10%+ win-rate lift in year one. That compounds; month one won't show it.
Download the template
- Win/Loss Analysis Template (XLSX) — 8 fields, deal list tab, interview notes tab, aggregate reporting tab. Fork and rename.
- Win/Loss Interview Script (PDF) — 12 questions, probe prompts, consent script, 30-minute structure.
For broader context before your first batch, the parent 7-step win/loss program covers the full framework, and our competitive intelligence guide shows how deal patterns feed back into positioning and battlecards.
Not ready to run interviews? Subscribe to the Unkover newsletter — one practitioner-grade CI playbook per week, no fluff.
FAQ
How often should you do a win/loss analysis?
Run interviews continuously — 5 to 8 per month is typical — and aggregate at least quarterly. Klue's 2025 data shows 70% of programs analyze deals within a month of close and 44% report quarterly; those are your floors, not ceilings.
Who should own the win/loss analysis program?
Product marketing owns it at most B2B SaaS companies, with a dotted line to RevOps for CRM integration and sales leadership for rep compliance. The key is a named owner whose KPI includes both interview volume and action follow-through — not a committee.
How many deals should you analyze per quarter?
Enough to see a pattern — usually 10–15 interviews per quarter minimum. If you close fewer than 30 deals, interview every lost deal plus a sample of wins. If you close hundreds, stratify by ARR tier and primary competitor so each segment gets at least 5 interviews.
What format should a win/loss analysis template be — Excel, Google Sheets, or something else?
Whichever one your team already lives in. Google Sheets wins for most mid-market teams: forkable, commentable, and plays nicely with CRM sync via Coefficient or Zapier. Excel is fine if security demands it. Format matters far less than whether it's one click from the CRM.