TL;DR: Win/loss analysis is a structured process of interviewing buyers after closed deals to learn why you won or lost. Most SaaS teams skip it because they trust CRM data, but research shows 85% of closed-lost CRM data is wrong. This guide walks you through seven steps to build a win/loss program on any budget: define your goals, build an interview pipeline, ask the right questions (we give you 12 ready-to-use ones), collect supplemental data, analyze patterns using our Win/Loss Quadrant framework, report findings that drive action, and close the loop. Companies that run systematic win loss analysis programs improve win rates by 15-25% over two years. You don’t need expensive software to start. You need a process.
This is the win/loss analysis problem that most SaaS teams never solve. They capture a dropdown value in Salesforce, file the deal away, and move on. But that dropdown is almost certainly wrong. When Clozd compared CRM data from 1,000 closed-lost deals against first-hand buyer interviews, the information aligned only 15% of the time. That means 85% of the reasons your team records for losing deals are inaccurate or incomplete.
The fix isn’t better CRM hygiene. It’s talking to the people who made the decision.
Win/loss analysis gives you that process. And you don’t need a $30K platform or a dedicated analyst to run one. In this guide, we’ll walk through the seven steps to build a win loss analysis program that delivers real answers, using tools you already have and a win/loss analysis template framework you can put to work this quarter.
What Is Win/Loss Analysis (and What It Isn’t)?
Win/loss analysis is a structured review of closed deals, both won and lost, to identify patterns in why buyers chose you or chose a competitor. It’s built on direct buyer feedback, not internal assumptions.
Here’s what it is not:
- Not a pipeline review. Pipeline reviews are forward-looking. Win/loss analysis looks backward at completed deals to find patterns.
- Not a deal post-mortem. Post-mortems dissect a single deal. Win loss analysis aggregates insights across dozens of deals.
- Not CRM data mining. CRM fields capture what reps think happened. Win/loss interviews reveal what buyers actually experienced.
The real point: win/loss analysis is about the buyer’s perspective. Your reps can tell you what happened on their side of the table. Only the buyer can tell you what happened on theirs, what your competitors said, which features mattered most, and what ultimately tipped the decision.
How to calculate win rate and win/loss ratio:
- Win rate: Wins / Total Decisions x 100. If you won 25 out of 100 decided deals, your win rate is 25%.
- Win/loss ratio: Wins / Losses. If you won 25 and lost 75, your win/loss ratio is 0.33.
Exclude “no decision” and stalled deals from both calculations. They muddy the picture.
Why Bother? The Business Case for Win/Loss Analysis
If you’re wondering whether a sales win loss analysis program is worth the effort, here’s the data.
McKinsey research found that companies with systematic win/loss programs improve win rates by 15-25% over two years compared to teams relying on rep self-reporting alone. Gartner’s research goes further: organizations running comprehensive programs report up to 50% improvement in win rates, with a 15-30% increase in revenue.
And with 84% of businesses saying their markets are increasingly crowded according to Crayon’s State of Competitive Intelligence Report, understanding why you win and lose isn’t optional anymore. It’s table stakes.
A well-run win/loss program delivers four concrete outcomes:
- Better battlecards. Real buyer language about competitor strengths and weaknesses feeds directly into the competitive battlecards your reps use on calls.
- Sharper product roadmap. Feature gaps cited in lost deals give product teams prioritization data backed by revenue impact.
- Improved sales training. When you know which objections trip up your reps, you can build targeted coaching around real scenarios.
- Stronger competitive positioning. Understanding how buyers perceive you versus competitors lets you adjust messaging based on evidence, not guesswork.
These outcomes compound. Each insight from win/loss analysis feeds into future deals. You update your battlecards. Reps handle the objection better. Your win rate against that competitor improves. Then the next round of interviews shows you the new gap. This is the competitive intelligence loop in action.
Addressing the skeptic: “We already know why we lose.” You probably don’t. When buyers list 4-5 reasons for their decision in a win/loss interview, reps can accurately identify only one of those factors roughly 15% of the time. The internal narrative is almost never the full story.
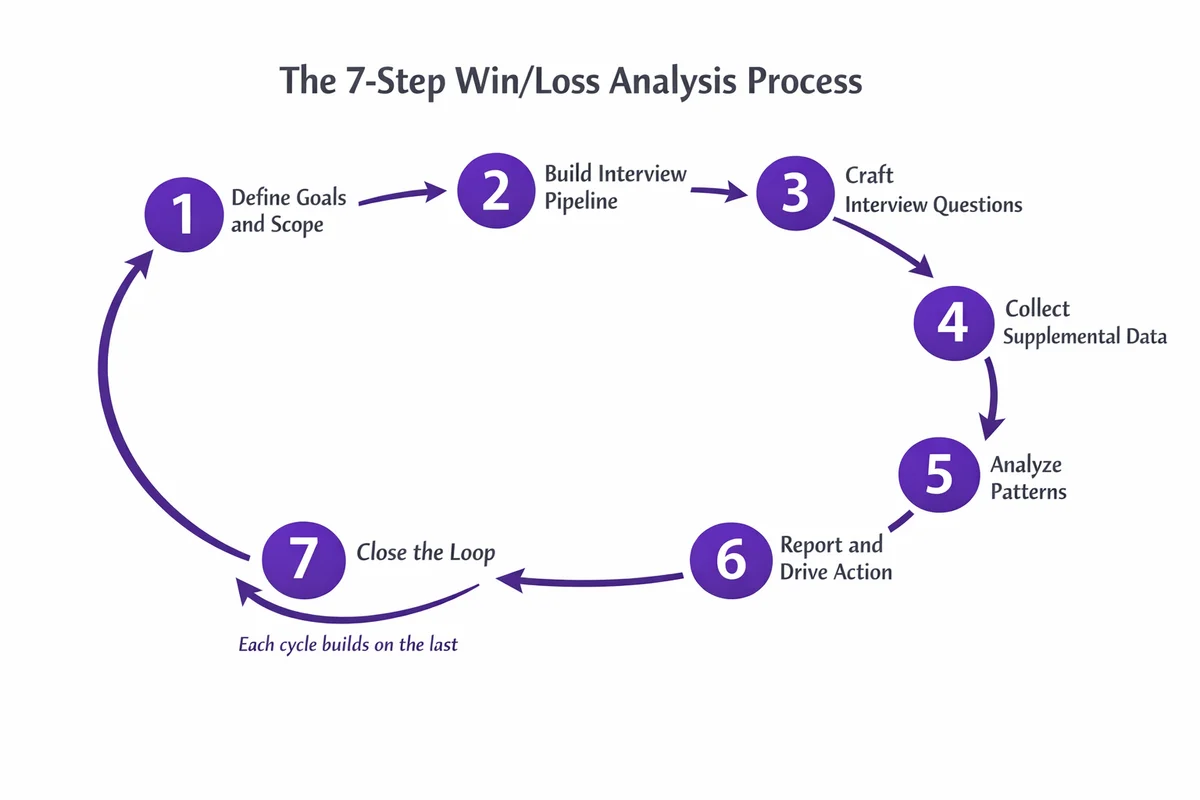
The 7-Step Win/Loss Analysis Process
Here’s the complete process. These steps are sequential when you’re building the program, but they become cyclical once it’s running, with each quarterly cycle building on the last.
- Define your goals and scope
- Build your interview pipeline
- Craft your interview questions
- Collect supplemental data
- Analyze patterns (not individual deals)
- Report findings and drive action
- Close the loop
Step 1: Define Your Goals and Scope
Start by deciding what question you’re trying to answer. Broad questions like “why do we lose?” produce broad answers. Narrow questions produce actionable insights.
Good starting questions:
- Why do we lose to [specific competitor] in mid-market deals?
- Why do enterprise deals stall in the evaluation stage?
- Why do inbound leads convert at twice the rate of outbound?
- Which types of competitors are we losing to most frequently?
Choose your scope. You don’t need to analyze every deal. Start with a defined segment:
- Competitive deals only (where a named competitor was involved)
- Deals above a certain ACV threshold (e.g., $10K+)
- Deals from a specific time period (last quarter is ideal)
Set your cadence. Quarterly is the sweet spot for mid-market SaaS teams. It’s frequent enough to catch trends and infrequent enough to accumulate a meaningful sample size.
Practical tip: Start narrow. “Deals lost to our top two competitors in Q1” is a better first program than “all closed deals in the last year.” You can always expand scope later. Starting too broad means you’ll run out of steam before you find a pattern.
Step 2: Build Your Interview Pipeline
The biggest mistake teams make is treating win/loss as a reporting exercise where you analyze CRM fields. It’s an interview program. You need to talk to buyers.
Which deals to include: Aim for a balanced sample. Analyze both wins and losses. Studying only losses gives you a skewed picture. Wins reveal what’s working, what resonates with buyers, and which differentiators are actually landing.
Sample size: Target a minimum of 15-20 interviews per quarter for statistically meaningful patterns. Aim for at least 10 wins and 10 losses. If you’re doing segment-level analysis (by competitor, deal size, or persona), you’ll need 30-40 interviews per quarter.
Timing matters. Interview within 2-4 weeks of deal close while the experience is fresh. After 30 days, buyers start rationalizing their decision. After 60 days, they can barely remember who they evaluated.
Who to interview: The decision-maker, not the champion or end user. For losses, you want the person who chose the competitor. For wins, you want the person who signed off on the purchase.
Getting participation: Frame the outreach as “help us improve,” not “tell us what went wrong.” Offer something in return: anonymized industry benchmarks, an executive summary of market trends, or a gift card. Expect a 10-30% response rate, so build a pipeline of 50-60 deals to hit your target of 15-20 completed interviews.
Practitioner Insight — Sales Alignment Is Non-Negotiable
The most common failure point for win/loss programs isn’t methodology. It’s getting the sales team to participate consistently. Experienced teams find that data collection discipline can’t be left as a suggestion from product marketing or ops — it needs to be actively championed and enforced by the CRO or Head of Sales. When leadership treats win/loss participation as optional, reps deprioritize it. When leadership mandates it, tracks compliance, and references the findings in pipeline reviews, participation follows. Get this sponsorship locked in before you run your first interview.
Step 3: Craft Your Win/Loss Analysis Questions
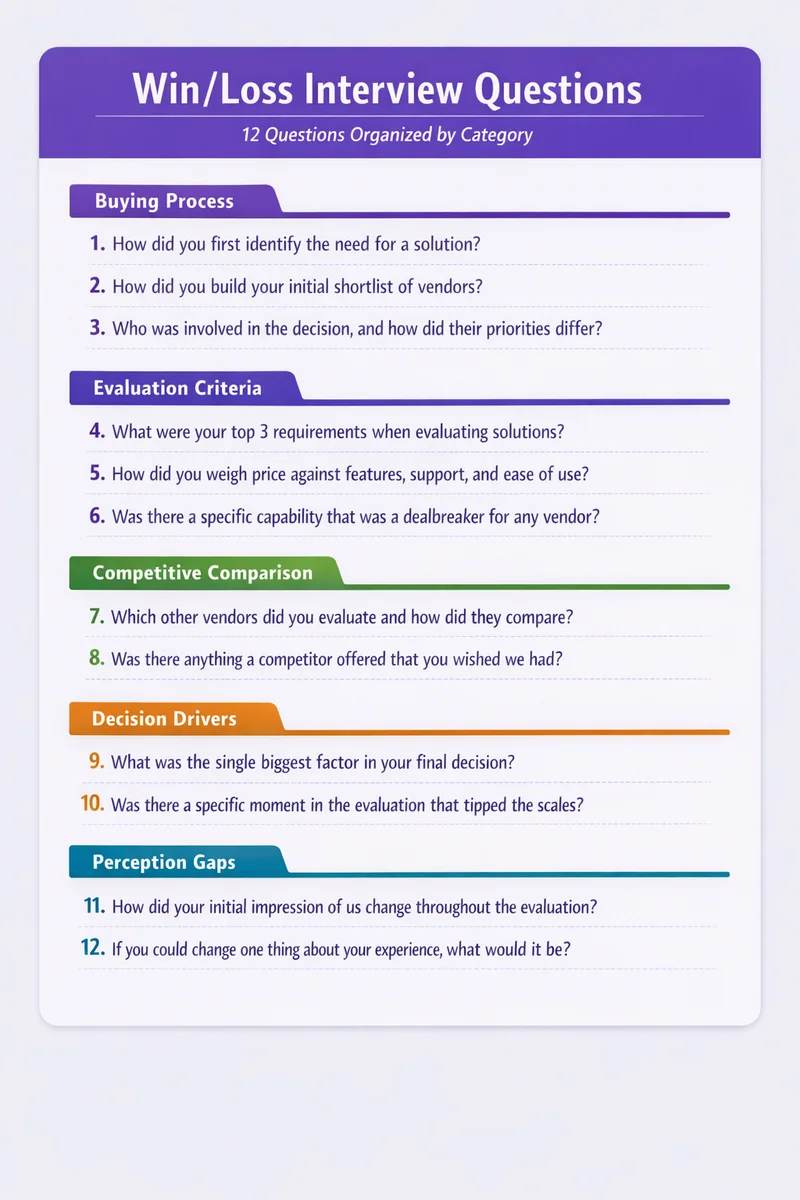
This is where most guides hand-wave. They say “ask the right questions” without telling you what those questions are. Here are 12 ready-to-use win/loss analysis questions, organized by the insight they uncover.
The cardinal rule: Don’t ask leading questions. “Why didn’t you choose us?” puts the buyer on the defensive. “Walk me through your evaluation process” gets the same answer without the bias.
Buying Process Questions
1. How did you first identify the need for a solution like ours? (Reveals awareness triggers and what prompted the search)
2. How did you build your initial shortlist of vendors to evaluate? (Shows where buyers discover you and your competitors)
3. Who was involved in the decision, and how did their priorities differ? (Uncovers the buying committee and internal politics)
Evaluation Criteria Questions
4. What were your top three requirements when evaluating solutions? (Identifies which criteria actually drive decisions)
5. How did you weigh price against features, support, and ease of use? (Reveals tradeoff hierarchy, not just a flat list)
6. Was there a specific capability that was a dealbreaker for any vendor? (Surfaces must-haves versus nice-to-haves)
Competitive Comparison Questions
7. Which other vendors did you evaluate, and how did they compare on your key criteria? (Direct competitive intelligence from the buyer’s mouth)
8. Was there anything a competitor offered that you wished we had? (Product gap identification backed by real demand)
Decision Driver Questions
9. What was the single biggest factor in your final decision? (Cuts through noise to the real driver)
10. Was there a specific moment in the evaluation that tipped the scales? (Identifies pivotal interactions, like a demo, reference call, or pricing conversation)
Perception Gap Questions
11. How did your initial impression of us change throughout the evaluation? (Shows whether marketing and sales are aligned on messaging)
12. If you could change one thing about your experience with our team, what would it be? (Captures process and experience feedback beyond product features)
Practical tips for interview execution:
- Keep interviews to 20-30 minutes. Participation drops sharply beyond 30 minutes.
- Record and transcribe with AI tools (Otter.ai, Fireflies.ai, or even Zoom’s built-in transcription) rather than taking notes live. You’ll catch nuances you’d miss while writing.
- Let silences breathe. Buyers often share their most honest thoughts after a pause.
- Use the “Five Whys” technique. When a buyer says “we went with them on price,” ask “what about the pricing was different?” and keep digging until you reach the root cause.
Step 4: Collect Supplemental Data (Beyond Interviews)
Interviews tell you why. But you need quantitative data to tell you what. Pairing both gives you the full picture.
CRM data worth pulling:
- Deal stage duration (did the deal stall anywhere?)
- Number of stakeholders involved
- ACV and deal size
- Lead source (inbound, outbound, partner)
- Loss reason (take it with a grain of salt, but it’s a starting point)
2026 Update — AI Has Changed the Free-Text vs. Multi-Choice Equation
For years, structured multi-choice CRM fields (dropdown lists for loss reason, competitor name, etc.) were essential because free-text responses were nearly impossible to analyze quantitatively at scale. You’d end up with hundreds of freeform notes that nobody could aggregate into trends.
That constraint is gone. AI tools like OpenAI and Claude can now extract competitor names, categorize loss reasons, and derive quantitative patterns from free-text CRM fields in minutes. The practical recommendation: use both. Keep structured multi-choice fields for quick dashboards and real-time reporting. Add a free-text field for nuance and context. Then run AI processing on the free text quarterly to surface insights that dropdown menus miss. Teams that adopt this hybrid approach get the speed of structured data with the depth of open-ended responses.
Sales call recordings. If you use Gong, Chorus, Aircall, or similar revenue intelligence tools, review recordings from key deal stages. Compare what reps actually said against your positioning guide. You’ll often find reps going off-script on competitive objections.
Competitor activity. Check whether a competitor changed pricing, launched a feature, or ran a targeted campaign during the deal cycle. This context can explain a cluster of losses that otherwise seems random. Tracking competitor moves is a core part of building a competitive intelligence program.
Firmographic patterns. Does your win rate vary by company size, industry, or tech stack? You may dominate in one segment and consistently lose in another. That’s a segmentation insight, not a product problem.
Marketing data. Which content did the buyer consume before the decision? Did they attend a demo, read a case study, or download a comparison guide? This connects marketing activity to deal outcomes.
Important: Supplemental data supports interviews. It doesn’t replace them. CRM data and call recordings tell you what happened. Only the buyer can tell you why.
Step 5: Analyze Patterns (Not Individual Deals)
This is where win/loss analysis becomes strategic. You’re not doing forensics on one lost deal. You’re looking for competitive win loss patterns across 20+ deals that reveal systemic strengths and weaknesses.
Key analysis dimensions:
- Win rate by competitor. Are you losing disproportionately to one rival? That’s a battlecard problem.
- Win rate by deal size / ACV band. Many teams win SMB but lose enterprise, or vice versa.
- Win rate by lead source. Inbound versus outbound versus partner tells you where your brand carries weight.
- Win rate by buyer persona. Do you win when the CTO leads the evaluation but lose when it’s procurement?
- Top cited decision factors (wins vs. losses). This is the most telling. What do buyers say mattered most?
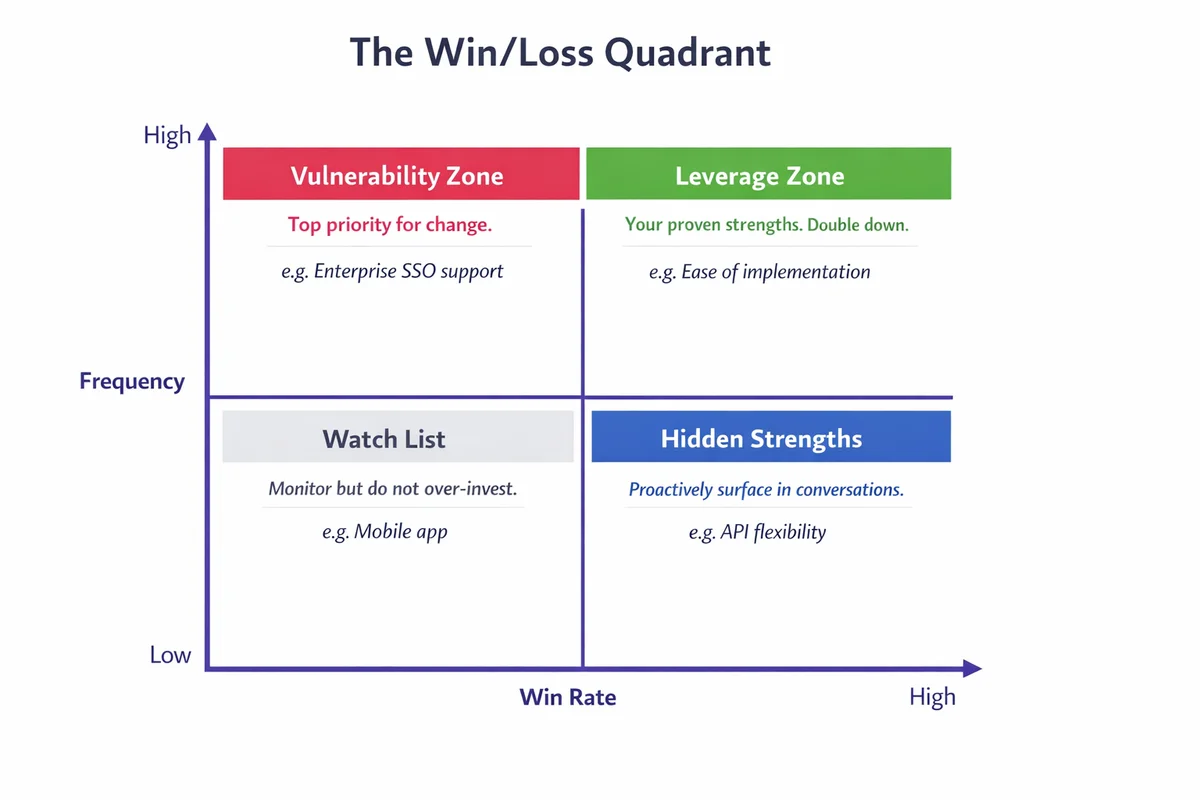
The Win/Loss Quadrant: A Framework for Prioritization
Once you’ve coded interview responses, plot the decision criteria buyers mention on two axes:
- X-axis: Win rate (how often you win when this criterion matters)
- Y-axis: Frequency (how often buyers mention this criterion)
This creates four quadrants:
| High Win Rate | Low Win Rate | |
|---|---|---|
| High Frequency | Leverage Zone — Your proven strengths. These criteria come up often, and you win when they do. Double down on these in positioning. | Vulnerability Zone — These criteria come up often, and you lose when they do. Top priority for product, sales training, or messaging changes. |
| Low Frequency | Hidden Strengths — You win when these come up, but buyers rarely mention them. Opportunity to proactively surface these in sales conversations. | Watch List — Rarely mentioned, and you lose when they do. Monitor but don’t over-invest. These may become important as the market shifts. |
Practical note: You can build this analysis in a spreadsheet. Create columns for each decision criterion, mark which deals mentioned it and whether you won or lost, then calculate win rate and frequency. No specialized software required.
Step 6: Report Findings and Drive Action
This is where most win/loss programs die. The analysis is solid, but the insights never reach the people who can act on them. The report sits in a shared drive, unopened.
The fix: tailor your reporting to each audience.
Sales leadership needs:
- Win rate trends over time (is it improving or declining?)
- Top three loss reasons with specific examples
- Competitor-specific gaps in current battle cards
- Recommended training topics based on rep-level performance patterns
Product team needs:
- Feature gaps cited in lost deals, ranked by revenue impact
- “Must-have” requirements you don’t meet today
- Competitive feature parity matrix (what competitors offer that you don’t)
Marketing needs:
- Messaging gaps (how buyers perceive you vs. your intended positioning)
- Content that influenced decisions (or content that was missing)
- Competitive positioning accuracy (are your comparison pages truthful?)
Executive team needs:
- One-page summary: market positioning, competitive shifts, and revenue impact
- Three specific recommendations with owners and deadlines
- Trend lines, not just snapshots
Report format: Lead with a one-page executive summary. Put the detailed data in an appendix. Executives read the summary. Operators read the appendix.
Practical tip: Lead with money. “We lost $1.2M in pipeline to Competitor X last quarter because buyers cited [specific gap] in 8 out of 12 competitive losses” gets executive attention faster than “buyers perceive our UX as weaker than the competition.”
Cadence: Quarterly reports, monthly metrics dashboard. Keep the program visible.
Step 7: Close the Loop (Iterate and Improve)
Win/loss analysis isn’t a project. It’s a program. Each cycle should improve the next.
Update your battlecards. Fresh win/loss insights are the best input for competitive battlecards. If buyers keep citing a competitor’s onboarding experience as the reason they switched, your reps need a ready response.
Track whether changes move the needle. If your #1 loss reason last quarter was “lack of enterprise SSO,” and your product team shipped it, did your win rate against that competitor improve the following quarter? If not, there’s a deeper issue.
Expand scope over time. Start with your top two competitors. Once the program is running smoothly, add more. Then segment by deal size, region, or persona.
Revisit your interview questions. As your product evolves and the market shifts, your questions should evolve too. Swap out questions that consistently produce low-value answers.
Build institutional memory. Don’t just file quarterly reports. Maintain a running log of key insights, decisions made, and results achieved. New team members will rely on it for context, and leadership will reference it in reviews.
Connect to broader CI. Win/loss data is one of the most useful inputs into your competitive intelligence program. It sharpens your battlecards, refines positioning, and pressure-tests whatever market assumptions are driving your strategy.
What About Product-Led Growth Companies?
The seven steps above are most effective for sales-driven organizations where deals involve a human buyer, a defined evaluation, and a clear win or loss moment. But what if your model is self-service or product-led growth (PLG)?
For PLG companies, there’s no deal close conversation to debrief. Users sign up, try the product, and either convert or leave — often without talking to anyone on your team. Traditional win/loss interviews don’t apply directly, but the competitive intelligence goal is the same: understanding why people chose you or chose someone else.
Two approaches that experienced PLG teams use:
- Trial cancellation surveys. When a user cancels their trial or downgrades, trigger a short survey asking whether they chose another product and which one. Keep it to 2-3 questions. Completion rates drop sharply beyond that.
- Churn interviews. When paying customers cancel, conduct brief exit interviews asking whether they’re switching to a competitor, and what drove the decision. Even a 10-15% response rate on churn interviews produces useful competitive data over a quarter.
This isn’t traditional win/loss analysis. But it achieves the same outcome: quantifiable data on why you’re winning and losing, segmented by competitor, that feeds directly into product and positioning decisions.
Tools for Win/Loss Analysis: What You Actually Need
If you’re running a win/loss program, you almost certainly have a CRM. Use it properly — that’s the recommended starting point.
CRM Integration (Recommended Baseline)
The best first step is adding dedicated win/loss fields to your existing CRM (Salesforce, HubSpot, Pipedrive, or whatever your team uses). Create custom fields for:
- Primary competitor(s) evaluated
- Win/loss reason (structured multi-choice + free-text field)
- Buyer’s stated top decision criteria
- Interview completed (yes/no) with a link to the recording
This embeds win/loss data collection into the workflow your reps already follow. No new tools, no new logins — just better fields in the system they use daily. If you’re sophisticated enough to run win/loss analysis, you have the CRM infrastructure to support it.
$0 Stack (Starting Lean)
If you want to validate the process before committing to CRM customization:
- Tracking and analysis: Google Sheets or Excel for deal tracking, interview coding, and pattern analysis
- Surveys: Google Forms for structured post-deal surveys
- Interviews: Zoom (free tier) for recorded calls
- Transcription: Otter.ai (free tier) or Zoom’s built-in AI transcription
- Reporting: Google Slides for quarterly presentations
This is a fine way to prove the concept. But plan to migrate into your CRM once the program is running — spreadsheets don’t scale past two quarters.
$100-500/mo Stack (Call Intelligence + Interview Tools)
- Call analysis: Gong, Chorus, or Aircall for automated sales call recording, analysis, and extraction into your CRM. These tools can automatically surface competitor mentions, objection patterns, and loss signals from recorded calls — saving hours of manual review. They get expensive quickly, but the value extends well beyond win/loss into general sales intelligence, coaching, and deal inspection.
- Interview management: Dovetail or Grain for organizing and tagging interview recordings
- CRM analytics: Built-in analytics from HubSpot, Salesforce, or your existing CRM
Add these when your interview volume exceeds 20 per quarter and you need faster analysis.
$500+/mo Stack (Dedicated Win/Loss Platforms)
- Clozd: Purpose-built win/loss analysis platform with managed interview services
- AskElephant: AI-powered win/loss with automated buyer surveys
- Klue: Integrated CI + win/loss platform (also covers competitive monitoring)
Our recommendation: Start with CRM integration. Run two quarterly cycles. Prove the value internally. Then evaluate whether dedicated tools or call intelligence platforms accelerate what you’re already doing.
For a broader view of competitive intelligence tools that complement win/loss analysis, see our competitive intelligence tools roundup.
Five Mistakes That Kill Win/Loss Programs
1. Only analyzing losses. It’s tempting to focus on what went wrong. But wins are equally instructive. They tell you what’s working, which differentiators are landing, and where your competitive advantage is strongest. Analyze both.
2. Having reps interview their own deals. Buyers won’t be honest with the person who just sold (or failed to sell) them. Use someone from product marketing, sales ops, or an external party. The data quality difference is dramatic.
3. Treating it as a one-time project. Running win/loss analysis once is a project. Running it every quarter is a program. One-time efforts produce one-time insights that are stale within months. Commit to a quarterly cadence or don’t bother.
4. Not acting on findings. The fastest way to kill executive support is to deliver insights no one acts on. Every quarterly report should include three recommendations with clear owners and deadlines. Follow up on last quarter’s recommendations.
5. Relying solely on CRM data. Self-reported loss reasons are 85% inaccurate. CRM data is a starting point, not the answer. The interview is the answer.
Frequently Asked Questions
What is a good win rate in SaaS?
The average B2B SaaS win rate for competitive deals is 20-30%. Top-performing teams achieve 40-50%. But averages hide important variation: win rates differ significantly by deal size (SMB deals close at 28-35%, enterprise deals at 12-18%), lead source (inbound typically converts 2x higher than outbound), and competitive field.
Don’t benchmark against industry averages. Benchmark against your own win rate over time. That’s what win/loss analysis measures.
How do you calculate win/loss ratio?
Two formulas to know:
- Win/loss ratio: Wins / Losses. Example: 30 wins / 70 losses = 0.43.
- Win rate: Wins / Total Decisions x 100. Example: 30 wins / 100 decided deals = 30%.
Important: Exclude “no decision” deals and stalled opportunities from both calculations. Including them inflates your denominator and makes your win rate look artificially low. Only count deals where a decision was actually made.
Should win/loss interviews be done internally or by a third party?
Internal interviews are cheaper, faster to set up, and create a tighter feedback loop between the interviewer and the sales team. The trade-off is that buyers may be less candid, especially about losses.
Third-party interviews produce more honest responses, particularly for competitive losses. But they’re slower (typically 4-6 weeks per study) and more expensive ($2-5K per study, depending on scope).
Our recommendation: Start with internal interviews. Train someone from product marketing or sales ops to conduct them. Go third-party for high-stakes competitive losses or annual deep-dive reviews once your program is established.
How many deals should I analyze?
- Minimum: 15-20 interviews per quarter for patterns to emerge
- Ideal: 30-40 per quarter for segment-level analysis (by competitor, deal size, buyer persona)
Below 15, you’ll see anecdotes. Above 15, you start seeing trends. Above 30, you can slice the data by segment and still have reliable insights.
How long does it take to see results from win/loss analysis?
- First actionable insights: Within one quarter (after 15-20 interviews)
- Measurable win rate improvement: 2-3 quarters of consistent execution
- Significant program impact: 12-18 months for full organizational integration
The quickest wins come from updating battlecards with fresh buyer language and addressing obvious gaps in sales training. The deeper structural changes, like product roadmap shifts or repositioning, take longer to implement and measure.
Start Small, Learn Fast
Commit to a quarterly win loss review and follow these seven steps:
- Define your goals and scope
- Build your interview pipeline
- Ask the right questions (use the 12 above)
- Collect supplemental data beyond interviews
- Analyze patterns with the Win/Loss Quadrant
- Report findings tailored to each audience
- Close the loop and iterate
You don’t need permission or budget to start. Pick your last 10 competitive losses. Email the buyer. Ask five questions. You’ll learn more from those 10 conversations than from a year of CRM data.
Every insight you uncover goes straight into better competitive battlecards, sharper positioning, and stronger sales conversations. Win/loss analysis is where competitive intelligence goes from theoretical to operational.
Building a CI program? Read our guides on competitive intelligence fundamentals and competitive intelligence tools to connect win/loss analysis into a broader competitive strategy.
Subscribe to the Unkover newsletter for frameworks, templates, and intelligence strategies delivered weekly.