
Last updated: June 2, 2026—by the Unkover editorial team
TL;DR
- A 10-field competitor analysis template built for B2B SaaS—not a 40-column dump grid.
- Includes a Google Sheets copy (ungated, no email) and an Excel
.xlsxdownload.- Three tabs ship inside the file: MVP tracking grid, head-to-head comparison matrix, and an example tab populated with five fictional SaaS competitors.
- Designed to live inside a 15-minute weekly workflow, not a one-off audit.
- Download the Excel file or open the Google Sheets copy and File → Make a Copy.
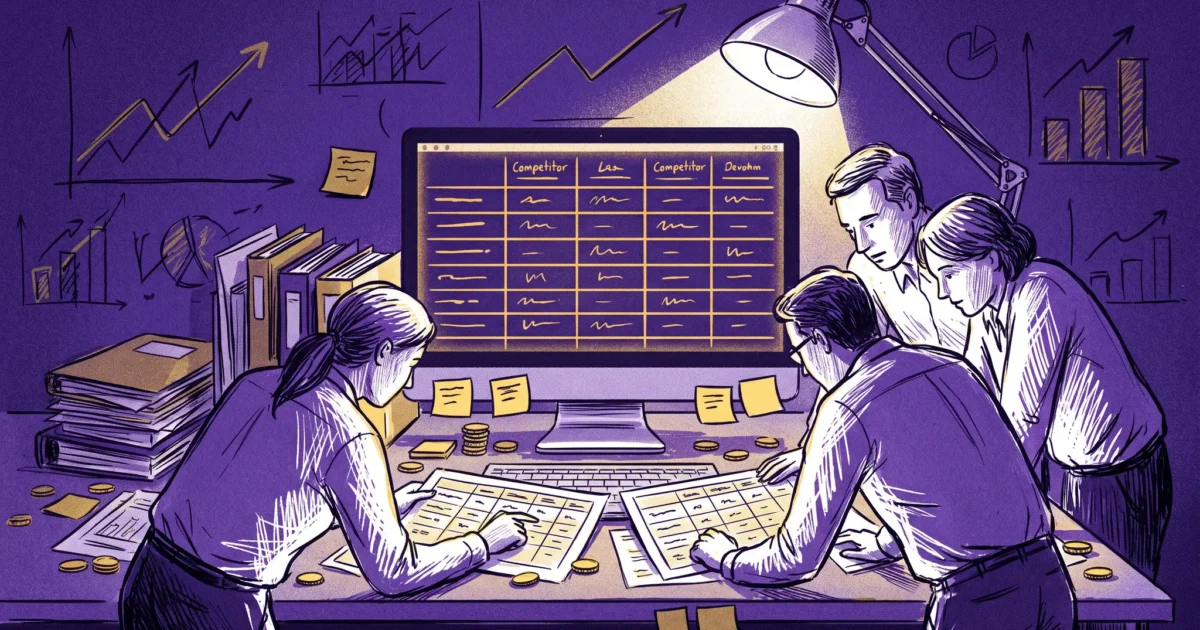
Most competitor analysis templates fail the same way. They ship 40 columns, get populated once, and rot inside a shared drive. Nobody opens them. Sales never sees them. The board asks "what are competitors doing?" and somebody starts a new doc.
This is a smaller template—10 fields per competitor, three opinionated tabs, and a weekly cadence that keeps it current. It's built for the strategic operator running a CI program without enterprise headcount: a product marketer, a CI manager, or a founder filling the role until they can hire one. The full process around the template lives in our competitive analysis framework guide—this post is the artifact.
Two formats, both ungated. Pick what your team already uses.
What a competitor analysis template actually needs
A competitor analysis template is a structured worksheet that captures who your competitors are, what they sell, how they position it, and where they're strong or weak—in a format you can refresh on a fixed cadence. The useful version is small enough to fill in every week, opinionated about what to leave out, and tied to a downstream output (battlecard, positioning doc, board update).
Ten fields are enough. Every winner on the SERP we audited bloats past that, and most of the extra columns sit empty after the first pass.
Here's the MVP grid that ships in tab one of the downloadable file:
| # | Field | What goes in it | Where to source it | Refresh cadence |
|---|---|---|---|---|
| 1 | Competitor | Company name + URL | Direct entry | Static |
| 2 | Product / offer | One-sentence summary of what they sell | Homepage hero + product page | Quarterly |
| 3 | ICP / target customer | Who they sell to (segment, size, role) | "For" sections, customer logos, case studies | Quarterly |
| 4 | Pricing model | Free tier, per-seat, usage, enterprise quote | Pricing page (use Wayback Machine for history) | Weekly |
| 5 | Positioning / core promise | Their one-line claim—verbatim if possible | H1 + meta description + LinkedIn tagline | Quarterly |
| 6 | Key differentiating features | 2–3 capabilities they lead with | Homepage, product tour, recent launch posts | Monthly |
| 7 | Primary marketing channels / messaging | SEO, paid, partnerships, community, etc. | LinkedIn ads library, Similarweb free tier, G2 profile | Monthly |
| 8 | Main strengths | 2–3 things they do well—externally verified | G2/Capterra reviews, public case studies | Monthly |
| 9 | Main weaknesses | 2–3 recurring complaints or visible gaps | G2 "cons" section, Reddit, Trustpilot | Monthly |
| 10 | Customer sentiment / notable review theme | Dominant pattern in recent reviews | G2, Capterra, Trustpilot (filter by last 6 months) | Monthly |
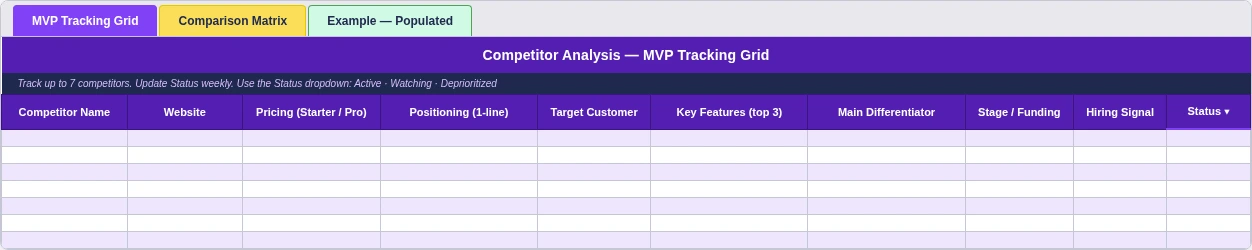
That's the whole grid. Five to seven competitor rows. No SWOT box. No five-year revenue projection. No mission statement column nobody fills in.
The 14 fields generic templates include—and why you should cut them
We pulled the field lists from Asana, Atlassian, Smartsheet, ProjectManager, and Canva. Across the five, the same padding columns show up. They look reasonable in the abstract. They sit empty in practice—and an empty column is worse than no column, because every reviewer assumes the gap means "we haven't checked."
| Field | Why it looks useful | Why it's noise for SaaS CI |
|---|---|---|
| Date completed | Audit trail | Already lives in file history; per-row date adds clutter |
| Analyst / owner name | Accountability | One owner per sheet, not per row |
| Competitor tier / weight | Helps prioritize attention | Becomes subjective; use a Status dropdown instead |
| Mission statement | "Strategic context" | Rarely changes a deal or shifts positioning |
| Key objectives | Frames their strategy | Unknowable for most private SaaS companies; goes stale fast |
| Company size | Sense of scale | Crunchbase has it on demand—don't duplicate |
| Revenue | Quantifies the threat | Usually unavailable or wrong for private SaaS |
| Market share | Validates competitive ranking | Guesswork outside large public markets |
| Place / distribution | 4 Ps habit | Built for retail/CPG; B2B SaaS distributes online |
| People / staffing | "Operational signal" | Too indirect; use a hiring-signal note in field 6 if needed |
| Process / order fulfillment | Process maturity | Irrelevant to a SaaS battlecard |
| Physical evidence / packaging | 4 Ps habit | Doesn't apply to software |
| Social follower counts | Brand traction | Vanity metric unless the article is about social benchmarking |
| Visual positioning map | "Strategic clarity" | Looks great in a deck; takes an hour to update and nobody reads it |
The simple test: would a sales rep, in the middle of a competitive deal, ever ask you for the value in this cell? If not, cut it. The template earns its place by being short enough to keep current.
Three template variants—pick the one that fits your goal
The same 10-field structure flexes into three jobs. Each variant ships as its own tab inside the downloadable file. Pick the one that matches what you're trying to produce this week. For a first-time landscape scan, use the research variant; for a sales battlecard input, use the comparison variant; for a running CI program, use the tracking variant.
Competitor research template
Use this when you're scoping a competitive landscape for the first time—a new market entry, a new product line, or a board request to "map the space." The job is breadth, not depth.
Key fields specific to this variant:
- Discovery source—where you found the competitor (G2 alternative-to page, customer mention, sales call, analyst report).
- Direct vs indirect—direct competitors solve the same job; indirect ones solve a related job your buyer also considers.
- Stage / funding—public Crunchbase or PitchBook data, dated. Useful for sizing the threat.
- Initial verdict—Track / Watch / Ignore. Forces a decision so the list doesn't grow forever.
Cap the discovery pass at 15–20 names, then prune to 5–7 before moving them into the MVP tracking grid. The goal is a shortlist, not a directory.
Competitor comparison template
Use this when sales needs a head-to-head battlecard input—usually one to four named competitors who show up in deals. The output feeds the comparison page on your website, the objection-handler in your battlecard, or the slide your AE pulls up on a call.
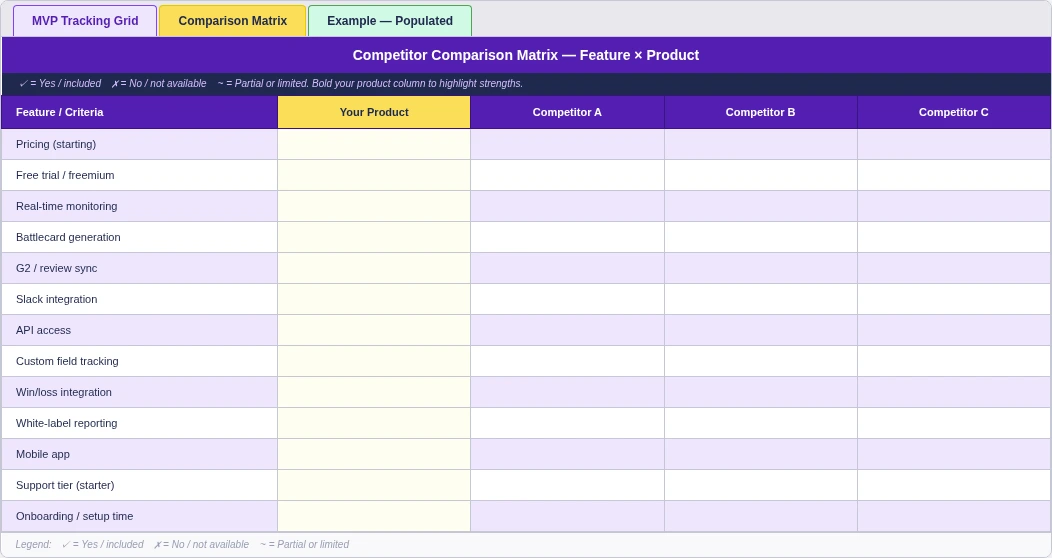
Key fields specific to this variant:
- Your product as a column, not a row. Reads more like a buyer would.
- Capability rows that map to buyer evaluation criteria—pricing tier, free trial, integrations, SSO, API access, mobile app, etc.
- Yes / no / partial cells, not paragraphs. Visual scanability matters here.
- A "winning angle" row at the bottom—one sentence per competitor on where you beat them.
For the deeper-dive on building these head-to-head grids, read our competitive matrix guide—this template's comparison tab is the working file version of that framework.
Ongoing competitor tracking template
Use this when CI is a continuing program, not a one-off audit. This is the default variant for an in-house CI function—the MVP grid, refreshed on the cadence in the table above, owned by one person, reviewed monthly.
Key fields specific to this variant:
- Status dropdown—Active / Watching / Deprioritized. Color-coded in the file (green / amber / red).
- Last refreshed column—populated by formula or by the owner during the weekly check.
- Change log—one row per detected change, with date, source link, and a one-line note.
- Cap—5–7 active competitors. Move the rest to a "Watching" sheet you skim quarterly.
The spreadsheet workflow—how to actually fill this in
A template only delivers ROI when somebody fills it in on a schedule. Here's the workflow we use to keep this one current. Total time: about 90 minutes for the first competitor, 20 minutes per competitor after that, and 15 minutes per week for maintenance.
Step 1—Initial setup (15 minutes)
- Open the file. Excel download here, or open the Google Sheets copy and File → Make a Copy.
- Name the tabs for your use case (MVP / Comparison / Discovery, or whatever your team uses).
- Freeze the header row (View → Freeze → 1 row in Sheets; Window → Freeze Panes → Top Row in Excel).
- Set sharing. Anyone with the link can comment. Edit access to two named owners—you and a backup.
- Lock validation dropdowns on the Status column. Active / Watching / Deprioritized. Color-code in conditional formatting: green / amber / red.
Step 2—Data collection (60 minutes for the first competitor)
Work field by field, not competitor by competitor. It's faster because you stay inside the same source.
For each field in the MVP grid, here's the fastest free source:
- Product, ICP, positioning—the competitor's homepage and a single product page. Don't read the whole site.
- Pricing—their pricing page. Screenshot it, then check the Wayback Machine for the prior version to see what changed.
- Key features—recent launch posts (their changelog or blog). Skip the marketing pages.
- Marketing channels—Similarweb (free tier shows top channels), LinkedIn Ads Library, G2 profile.
- Strengths and weaknesses—G2 and Capterra reviews, filtered to the last six months. Read the 1-star and 5-star reviews; ignore the middle.
- Customer sentiment—same source. Look for repeated phrases across reviews.
After the first competitor, the workflow compresses to 20 minutes per competitor because you already know which tab to open. For a full inventory of the free and paid tools that speed this up, we keep a separate guide.
Step 3—Weekly maintenance (15 minutes per week)
Three fields drift fastest in SaaS: pricing, positioning, and hiring signals (which proxy product roadmap). Block 15 minutes once a week to check those three across your 5–7 active competitors.
The fastest setup:
- Pricing—Wayback Machine alerts on the pricing URL, or Visualping on the page.
- Positioning—a Google Alert on the company name. Skim the weekly digest.
- Hiring—LinkedIn job postings filtered to engineering and product roles. Surge in postings often precedes a feature launch.
Log changes in the change log row, not as new rows. The template stays the same length.
Common failure modes
Four patterns kill these templates:
- Stale data. Nobody owns it; entries are months old. Fix: one named owner, calendar reminder, status dropdown that flags Active rows older than 30 days.
- Too many competitors. Lists grow to 20+ and nothing gets refreshed. Fix: cap Active at 5–7; everything else lives in a Watching sheet.
- No handoff. The grid lives in a drive nobody opens. Fix: feed it into a battlecard or board update on a fixed cadence (see the next section).
- Field bloat. Someone adds five more columns "to be thorough." Fix: every new field needs a stated use case. If the use case is "in case we need it," cut it.
This workflow covers the same ground as older spreadsheet-based approaches—tabs, frozen headers, data collection, and weekly maintenance—refreshed for the 2026 tool stack and built around a SaaS-first field set.
From template to action—what to do with a filled-in grid
A populated competitor analysis template is an input, not an output. The CI programs that show ROI are the ones that connect the grid to a downstream artifact somebody actually uses. Per Crayon's 2024 State of Competitive Intelligence report, 65% of B2B software opportunities are competitive—but 41% of CI leaders say they wish their sales team used the existing battlecards more often. Bridging the template to those assets is where the program earns its keep.
Four outputs the template should feed, with the named asset for each:
- A sales battlecard. Pull the Positioning, Differentiating Features, Weaknesses, and "winning angle" cells into a one-page battlecard for the top two or three competitors who show up in deals. Our sales battle cards guide covers the format.
- A competitive intelligence report for leadership. Roll up the change log into a monthly two-pager—what moved, what it means, what to do. Build it from the competitive intelligence report framework.
- A positioning update. When three or more competitors' positioning rows converge on the same claim, the differentiation cell on your own product is at risk. Trigger a positioning review.
- A pricing decision input. Pricing is the fastest-drifting field. A monthly pricing snapshot across your tracked set is a credible input for any pricing-committee discussion.
If a populated grid doesn't feed at least one of these, the template is a hobby. Pick one output and ship it.
Competitor analysis template: a worked example
The cleanest way to evaluate a template is to see it filled in. Tab three of the file ships with a populated example built around five fictional B2B SaaS competitive intelligence tools—CompeteEdge, RivalScan, MarketWatch Pro, ScopeRival, and InsightLoop. Every cell is filled in, so you can see what a complete row looks like before building your own.
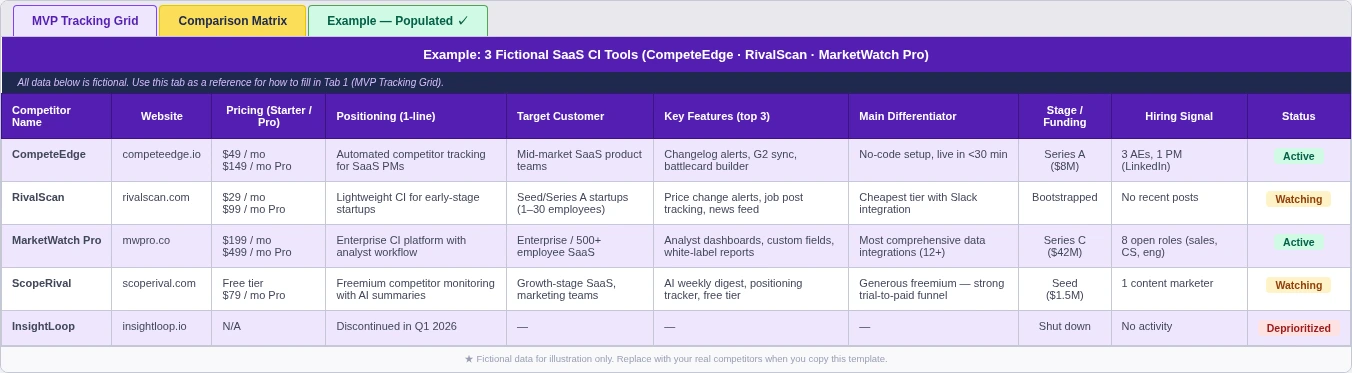
A few things to notice in the populated tab:
- Positioning rows are short. One sentence each, lifted from the homepage hero. No paraphrasing.
- Pricing cells include the model and a number. "Per-seat, $49/user/month" beats "competitive pricing" every time.
- Strengths and weaknesses each have two or three bullets max. Long lists stop being decision-useful.
- The Status column is doing real work. Two are Active, two are Watching, one is Deprioritized—with the deprioritization reason captured in the change log.
The five names are made up. The shape of the cells is what to copy. Replace the fictional companies with your actual competitive set and the template should feel familiar by the second row.
FAQ—competitor analysis template questions
What should a competitor analysis include?
The minimum useful competitor analysis includes the competitor name, what they sell, who they sell to, their pricing model, their positioning, two or three key features, and a short read on strengths and weaknesses backed by recent reviews. Anything beyond that is optional. Cut fields that nobody on your sales or marketing team will reference.
How do I make a competitive analysis template in Excel?
Start with the Excel file we ship in this post—it's pre-built with the 10-field MVP grid, the comparison matrix, and a populated example tab. If you'd rather build your own, create three tabs (MVP / Comparison / Example), freeze the header row, set a Status dropdown column with conditional formatting, and lock validation on any cell where you want consistent values.
What's the difference between competitor analysis and competitor research?
Competitor research is the discovery phase—finding out who plays in your space, scoping the landscape, deciding who to track. Competitor analysis is the ongoing work of evaluating a defined set of competitors against the dimensions that matter for your decisions. Research produces a shortlist. Analysis produces a battlecard or a board update.
How often should you update a competitor analysis?
Three fields drift weekly—pricing, positioning, and hiring signals. Plan a 15-minute weekly check on those. The rest of the MVP grid (ICP, features, strengths, weaknesses, sentiment) holds up on a monthly to quarterly refresh. Per the Crayon 2024 report, "keeping content fresh" is the single most-cited challenge in CI programs—short cadences beat heroic quarterly rewrites.
Is there a free competitor analysis template?
Yes—this one. Both formats are ungated. No email gate, no credit card, no "request access." Download the Excel file or open the Google Sheets copy and File → Make a Copy.
What are the 4 Ps of competitor analysis?
The 4 Ps—Product, Price, Place, Promotion—come from retail and consumer-goods marketing. For B2B SaaS, Product and Price translate well; Place (distribution) is almost always "online and direct," and Promotion is better broken out into specific marketing channels. The MVP template above replaces the 4 Ps with the seven fields that actually shift SaaS deals.
Ship the template, then keep it current
A competitor analysis template only matters if it gets filled in this week and refreshed next week. The MVP version above is small enough to make that realistic—10 fields, 5–7 competitors, three tabs, one named owner, a 15-minute weekly check on the three fields that drift.
Download the Excel file or copy the Google Sheets version. Populate one competitor today—pick the one that shows up in deals most often. Then read our competitive analysis framework guide for the process that wraps around the template.
For more practitioner-built CI assets like this one—frameworks, tool reviews, and templates—subscribe to the Unkover newsletter. One email, every other week. No pitches.